The Bollinger Bands Squeeze Strategy: A Trader’s Guide
Learn to identify low-volatility periods that often precede explosive market moves.
In trading, the most profitable opportunities often arise from sudden, sharp price movements. But how can we anticipate them? The Bollinger Bands Squeeze strategy is one of the most reliable techniques for identifying quiet periods in the market that frequently signal an impending volatility “storm.”
What Exactly Is a Bollinger Bands Squeeze?
Imagine compressing a spring as tightly as possible. The more energy you put into squeezing it, the more powerful its release will be. This concept is the foundation of the Squeeze strategy. In trading, that “spring” is market volatility.
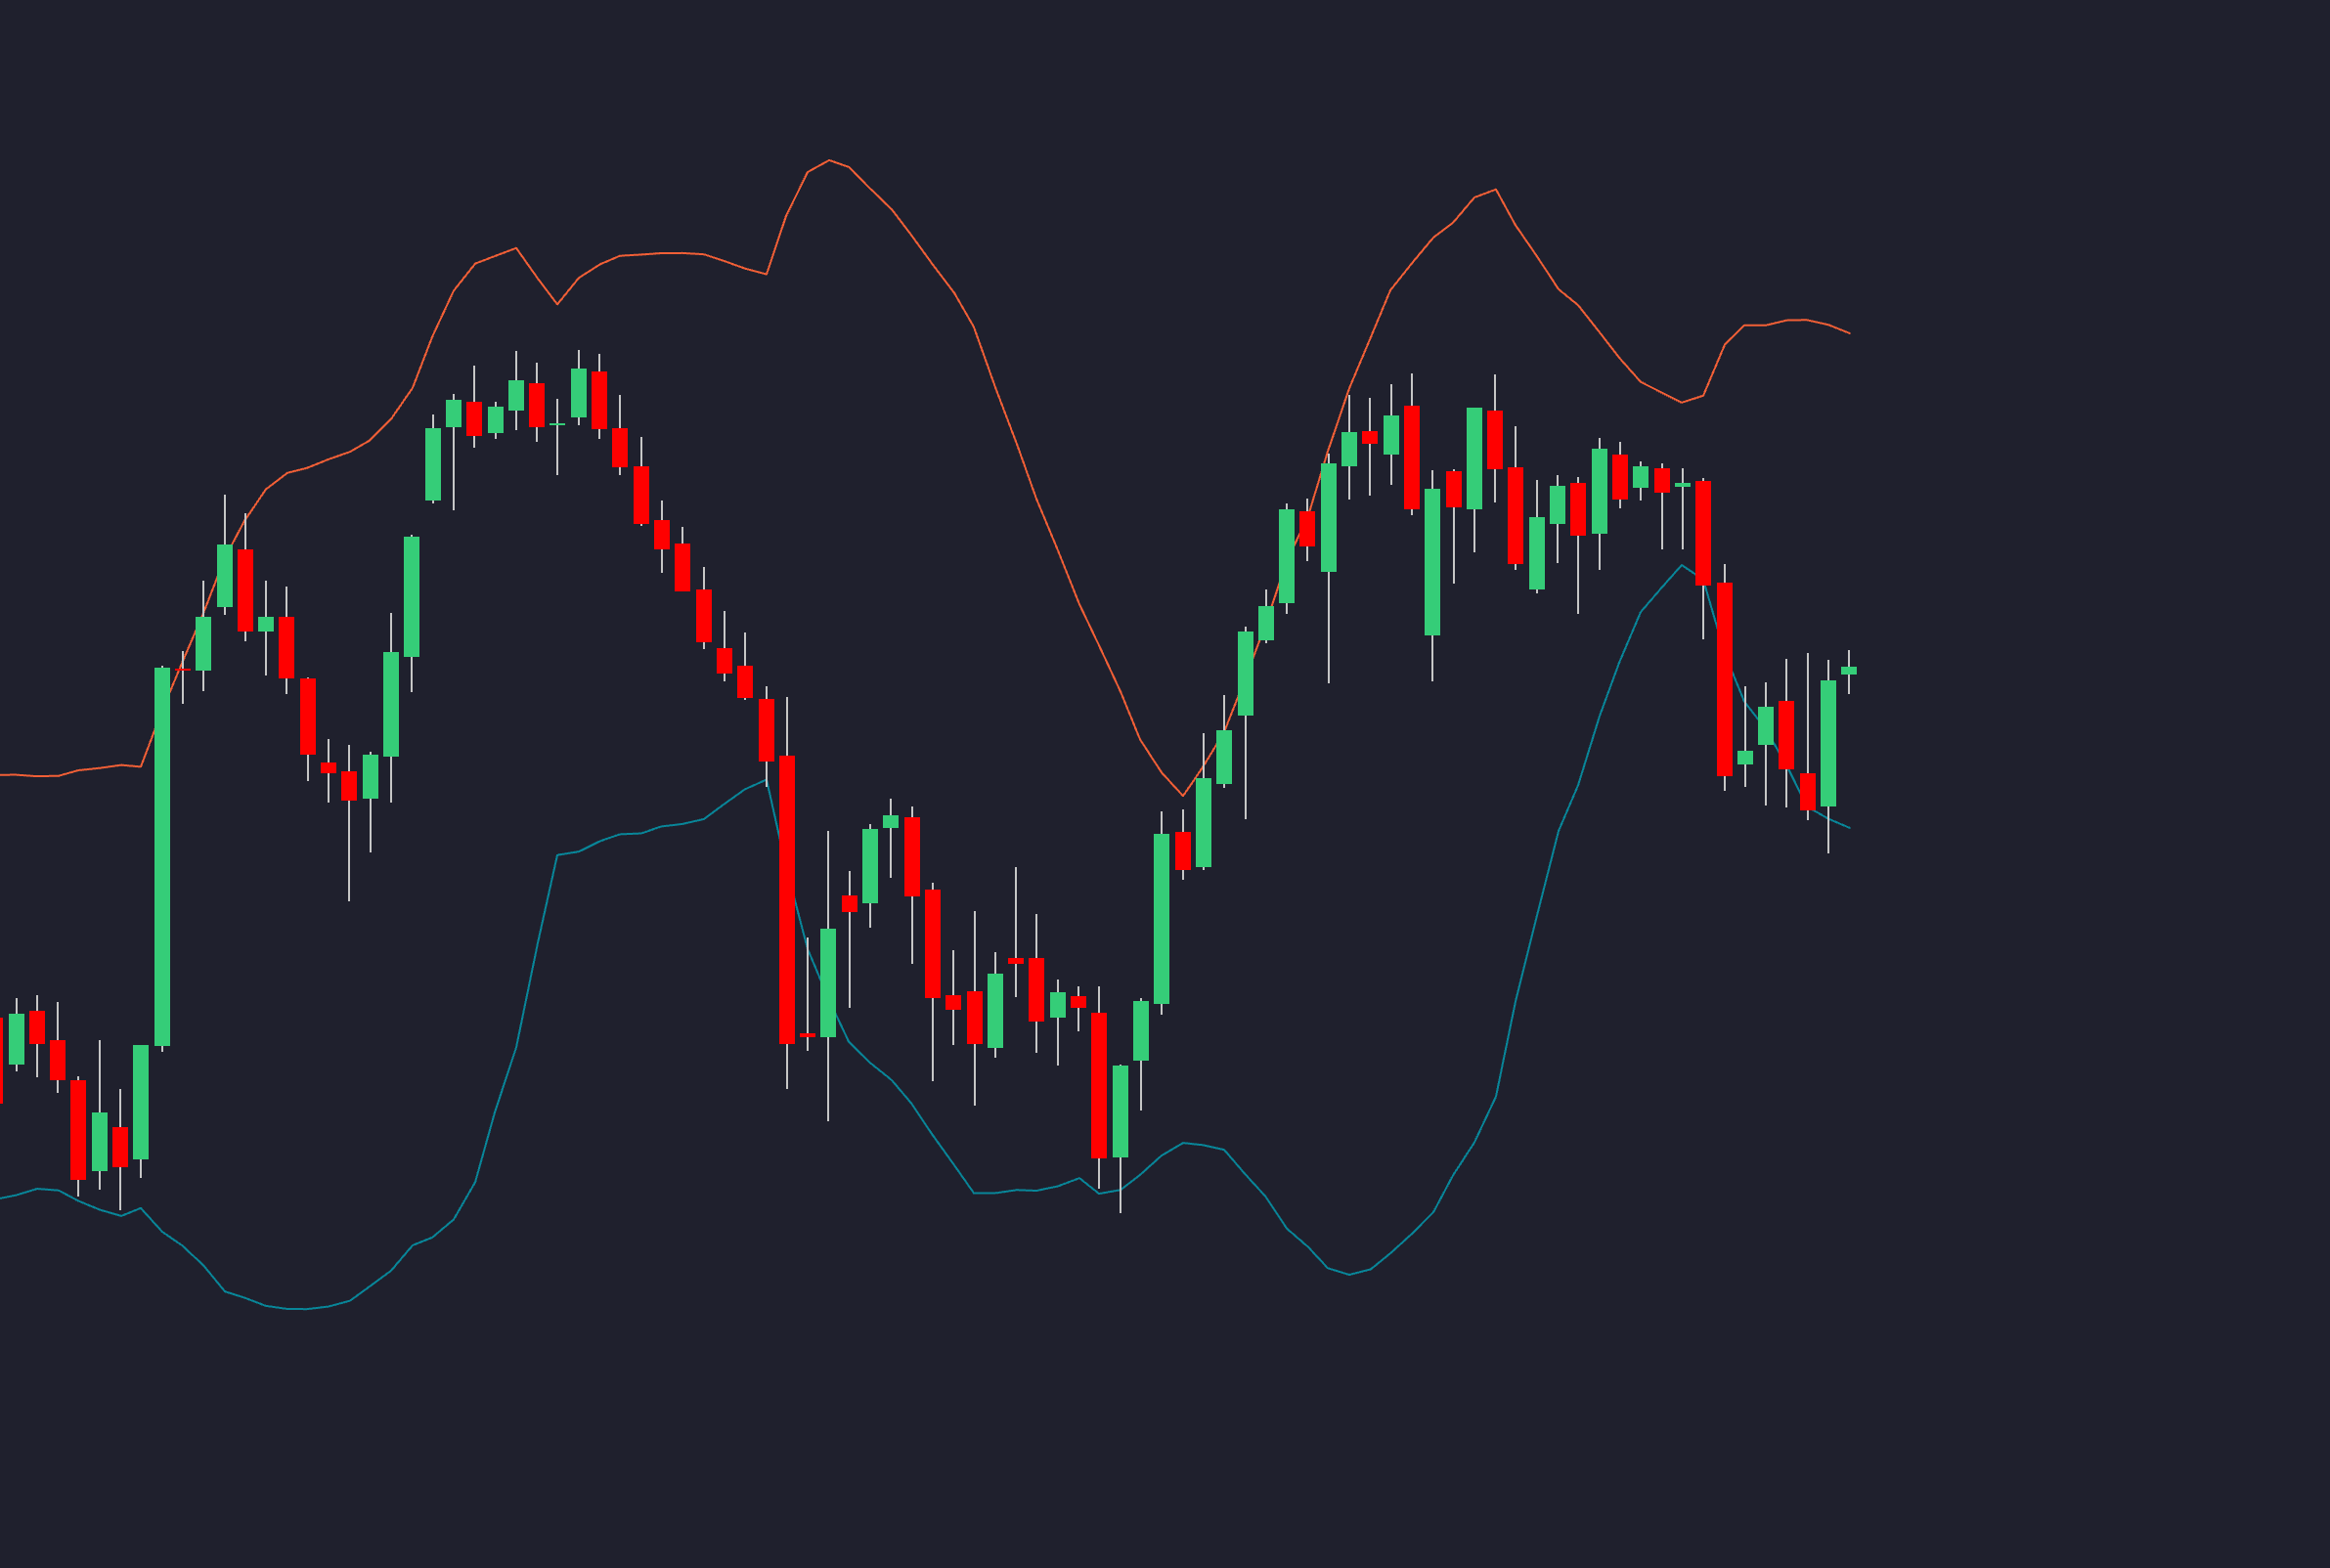
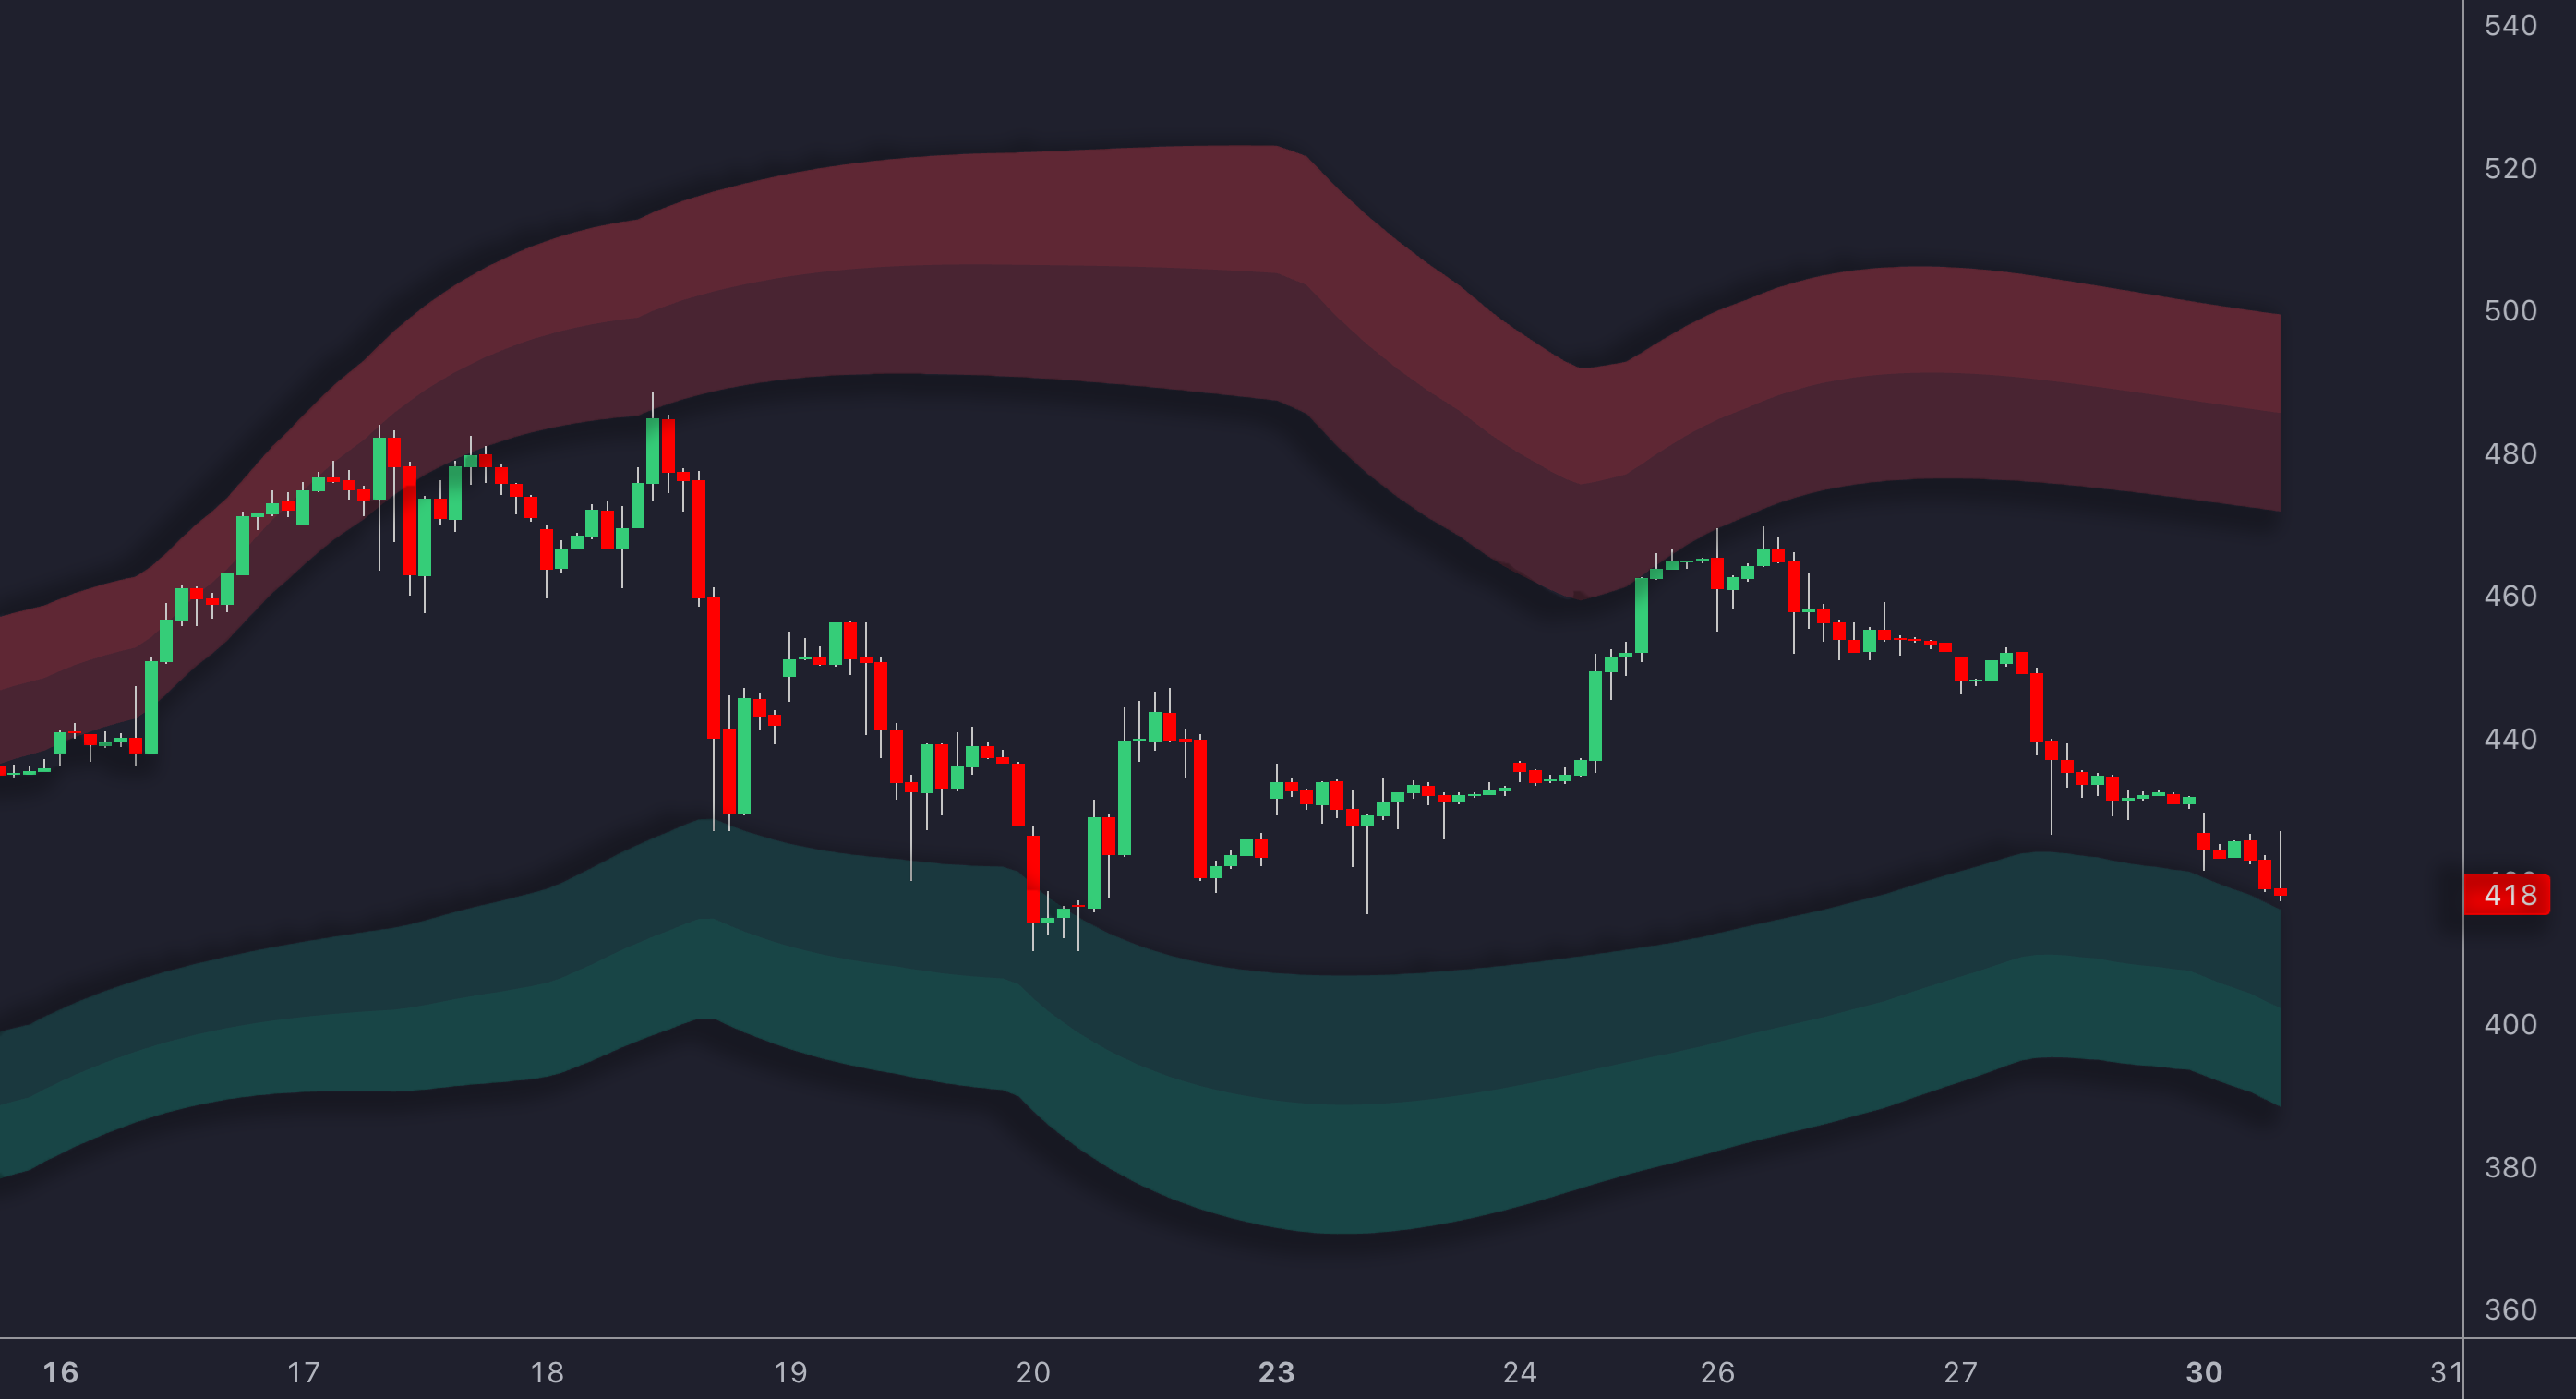
- 📈 The Squeeze: This is a period of very low volatility. Visually, it occurs when the Upper and Lower Bollinger Bands narrow and move closer to the Middle Band. The market is in a consolidation phase, “taking a breath.”
- 🚀 The Surge (or Breakout): After a prolonged Squeeze, the market tends to “explode” with a significant price movement in one direction. Our job as traders is to be ready to ride this wave.
How to Accurately Identify a Squeeze
Correctly identifying a Squeeze is the key to this strategy’s success. You can do this visually on your chart or with the help of a technical indicator.
1. Visual Identification on the Chart
The easiest method is to look for the narrowing of the Bollinger Bands directly. When the distance between the upper and lower bands becomes the narrowest it has been in a long time (e.g., several weeks or months), you are likely witnessing a Squeeze.
2. Using the Bollinger BandWidth (BBW) Indicator
For a more objective confirmation, use the Bollinger BandWidth (BBW) indicator. This tool specifically measures the width of the bands. When the BBW value reaches a historical low (e.g., a 6-month low), it is a strong confirmation that the market is in a mature Squeeze and is primed for a breakout.

How to Trade the Breakout (The Surge)
Once a Squeeze is identified, the next phase is to wait for the breakout. The biggest challenge here is distinguishing a genuine breakout from a false signal.
The key to a valid breakout is strength and confirmation. Don’t rush into a trade just because the price touches a band.
- A Strong Breakout Candle: A valid breakout is marked by a candle that closes decisively outside the Upper or Lower Band, not just its wick touching it.
- A Surge in Volume: This is the most important confirmation. A real breakout is almost always accompanied by a significant spike in trading volume, indicating strong market participation behind the move.
- Breaking a Key Level: If the breakout occurs at the same time as a break of a major support or resistance level, its validity increases dramatically.
Risk Management: The Key to Survival
Without proper risk management, even the best strategy will fail. Always place a stop-loss with discipline. A good rule of thumb is to place the stop-loss just outside the opposite band of the breakout. For example, if a bullish breakout occurs (breaking the Upper Band), place your stop-loss slightly below the Lower Band.
Pros and Cons of the Squeeze Strategy
Every strategy has its strengths and weaknesses. Understanding them will help you use it more wisely.
| ✅ Pros | ❌ Cons |
|---|---|
| Catches large moves and new trends early. | Prone to false breakouts without proper confirmation. |
| Provides very clear and easy-to-recognize visual signals. | Cannot predict the direction of the breakout. |
| Applicable across various markets (stocks, forex, crypto) and timeframes. | Requires patience, as the Squeeze phase can be lengthy. |
Frequently Asked Questions (FAQ)
How can I distinguish a genuine breakout from a false one in a Squeeze strategy?
To validate a breakout, focus on three things: 1) Candle Close: Ensure the candle closes firmly outside the band, not just touches it. 2) Volume: A genuine breakout is almost always accompanied by a significant spike in trading volume. 3) Context: A breakout is more valid if it successfully breaks through a key support or resistance level.
What is the role of the Bollinger BandWidth (BBW) indicator in this strategy?
The Bollinger BandWidth (BBW) indicator measures the distance between the upper and lower bands. When the BBW reaches its lowest level over a specific period (e.g., 6 months), it quantitatively confirms that the market is in a ‘Squeeze’ phase of low volatility, thus increasing the probability of a breakout.
What is the best way to manage risk when trading a breakout?
The best risk management involves three pillars: 1) Stop-Loss: Place a stop-loss just outside the opposite band from the breakout direction. 2) Position Size: Use a smaller position size when market volatility is high. 3) Confirmation: Never enter a trade based solely on a Bollinger Bands breakout. Always seek confirmation from other indicators like RSI or MACD, and especially volume.