Introduction: The Two States of the Market
Every financial market exists in one of two states: it is either exploring or it is caged.
When a market is exploring, it’s in a strong trend, boldly venturing into new price territories. When it’s caged, it’s in a ranging or sideways phase, pacing back and forth between a clear price ceiling (resistance) and a floor (support).
The classic RSI overbought/oversold strategy is a powerful tool, but it is designed exclusively for the caged market. Most traders lose money with it because they mistakenly try to use it when the market is exploring.
This guide will teach you how to identify the “cage” and how to use the RSI to trade the predictable bounces from its boundaries.
The Trend Trader’s Trap: Why This Strategy Fails in Breakouts

Before we learn the right way, we must understand the wrong way. Trying to sell an “overbought” RSI signal (above 70) in a powerful, trending market is like trying to catch a falling knife.
In a strong uptrend, the market’s momentum is a powerful force. The RSI can and will stay in the “overbought” zone for extended periods as the price continues to climb. Selling at the first sign of an overbought reading is a recipe for repeated small losses as the trend continues to run you over.
Remember this rule: The RSI 70/30 strategy is a reversal tool, and you cannot reverse a freight train. You can only anticipate a bounce off a wall.
Identifying the ‘Cage’: How to Spot a Ranging Market
Your first and most important job is to confirm that the market is indeed “caged.” Look for these signs:
- A Sideways Drift: Look at the chart’s history. Is the price generally moving horizontally, contained within a broad channel, rather than making a clear staircase of higher highs or lower lows?
- A Hard Ceiling & Floor: Can you draw obvious horizontal lines that connect multiple recent peaks (resistance) and multiple recent troughs (support)? These lines form the bars of your cage.
- Lack of Momentum: The price action is often choppy and indecisive, rather than strong and directional.
If you cannot clearly define this cage, do not use this strategy.
The Reversal Signal: A Step-by-Step RSI Range Trading Plan
Once you’ve confirmed the market is ranging, you can wait for the setup.
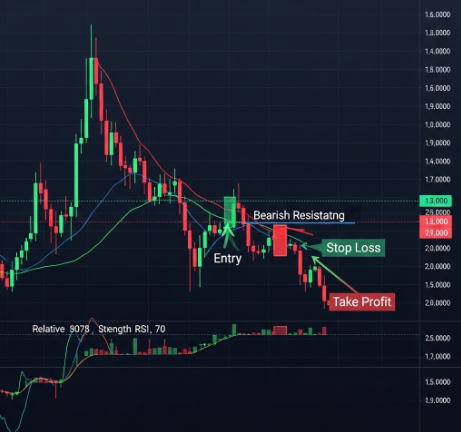
- Step 1: Wait for the Price to Test the Bars of the Cage.
- For a SELL trade: Wait for the price to move up and test the resistance level (the ceiling) of the range.
- For a BUY trade: Wait for the price to move down and test the support level (the floor) of the range.
- Step 2: Check the RSI for an Extreme Reading.
- At the resistance level, look for the RSI to be above 70 (overbought).
- At the support level, look for the RSI to be below 30 (oversold).
- Step 3: Wait for a Rejection Signal (Confirmation). This is the most critical step. Do not trade just because the RSI is overbought or oversold. Wait for a candlestick pattern to confirm that the price is being rejected from the boundary. Look for a Pin Bar, an Engulfing Pattern, or a Doji.
- Step 4: Execute and Manage the Trade.
- Entry: Enter the trade after your confirmation candle has closed.
- Stop Loss: Place your stop loss just outside the cage—a few pips above the high of your reversal pattern for a sell, or below the low for a buy.
- Take Profit: Your primary target is the opposite side of the cage (the support level for a sell, or the resistance level for a buy).
Conclusion: The Right Tool for the Right Job
The RSI overbought/oversold strategy is not a universal system for all market conditions. It is a specialized tool designed for one specific job: identifying high-probability turning points within a sideways, ranging market.
By learning to first identify the “caged” market environment and then patiently waiting for the confluence of a key level, an RSI extreme, and a price action confirmation, you can trade with a statistical edge.
The skill of identifying these conditions requires practice. A responsive charting platform is your laboratory for this hands-on research.
Your Analytical Laboratory: A Professional Charting Platform Training your eyes to spot ranging markets and RSI signals is best done on a clean and reliable charting platform. We recommend lekasfx because their MT5 platform provides the clear charts and accurate RSI indicator needed to practice this strategy effectively.
(Disclosure: We may earn a commission at no extra cost to you if you sign up through this link).